
Quick Summary
- An executive dashboard and a channel dashboard are different things, with different metrics, cadences, owners and decisions.
- The executive view should focus on True CAC, LTV:CAC with payback, qualified pipeline created, pipeline coverage, win rate, marketing-sourced and influenced revenue and revenue against target.
- Channel views hold the diagnostic metrics operators use to explain movement.
You built the marketing KPI dashboard. It has 25 or 30 metrics on it.
Every channel is represented. The data updates automatically.
And nobody has opened it in three weeks.
The problem probably isn't that the dashboard was built badly.
It was built for two audiences at once.
Executives need a small set of numbers that answer money questions: are we acquiring customers profitably, is there enough qualified pipeline, are we on track against the revenue target, and where should the next increment of budget go?
Operators need something different.
They need the diagnostic detail that explains why a number moved: cost per lead by channel, landing-page conversion, campaign pacing, sequence performance, keyword movement and the other inputs they can actually optimise.
Put both jobs on one screen and you get the worst of both: too much detail for the executive, not enough depth for the operator.
This guide will show you the executive metric set, the operator metric set and the four-question test that decides where any marketing metric belongs.
Let's get into it.
What a marketing KPI dashboard is (and what it's actually for)
A marketing KPI dashboard is a single view of the marketing metrics tied to business decisions. It shows whether marketing is contributing to profitable customer acquisition and qualified pipeline, what is moving in the wrong direction and where the next budget or operational decision needs to be made.
The important phrase there is business decisions.
A dashboard is a decision instrument, not a data display.
Its job isn't to prove that marketing is busy or to collect every number your tools can produce. It should help someone look at the state of the funnel and decide what happens next.
That distinction changes what belongs on the screen.
If a number moves and nobody changes a budget, investigates a problem, adjusts a target or makes another meaningful decision, it probably doesn't belong on the executive view.
It may still be useful as a diagnostic metric elsewhere. But at executive level, it's decoration.
This is also why a useful dashboard reports on funnel economics rather than marketing activity alone.
Understanding marketing ROI means connecting acquisition cost, pipeline and revenue, rather than simply reporting clicks, leads or campaign activity. That guide covers how marketing ROI works end to end. This page covers what to put on the screen.
Which raises the question most dashboard projects should ask much earlier: who is this dashboard actually for?
An executive deciding where money goes and an operator deciding what to optimise need different views. We'll separate them properly in a moment.
Why most marketing dashboards get built and then ignored
Most marketing dashboards start with sensible intentions.
Someone wants better visibility. The team connects the data sources. Every stakeholder suggests a few metrics they'd like to see.
Here's the problem: dashboards tend to accumulate information faster than they accumulate purpose.
Stephen Few, one of the best-known voices in dashboard design, makes a similar point in Why Most Dashboards Fail.
His argument is that the root problem is rarely technology. It's presentation: dashboards that include things they don't need, show numbers without enough context to interpret them and can't be taken in on a single screen.
In marketing, those problems usually show up in three ways.
The metric-count problem
Start with five important metrics and the dashboard feels useful.
Then someone asks for impressions. Someone else wants cost per lead. Another person adds CTR, CPC, conversion rate, traffic, MQLs, SQLs, keyword rankings and email performance.
Soon, there are 25 metrics competing for attention.
At that point, the problem isn't that any individual metric is useless. It's that the dashboard gives each one roughly the same visual importance.
When everything matters, nothing does.
An executive should be able to open the dashboard and quickly see whether the revenue-positive funnel is moving in the right direction and where intervention is needed.
If finding that answer means scanning three rows of channel diagnostics, the dashboard is making the reader do the prioritisation work.
The audience problem
This is usually the deeper issue.
The same dashboard is trying to serve an executive deciding where money should go and an operator deciding what needs fixing today.
The executive scrolls past campaign pacing, CPC, landing-page conversion and sequence performance, because those numbers rarely represent decisions they personally own.
Meanwhile, the operator gets the opposite problem.
A high-level tile saying qualified pipeline declined is useful as a warning. But it doesn't give enough granularity to diagnose whether the cause was targeting, creative, conversion, follow-up or something else.
Neither audience has the wrong needs. They simply need different views.
Put both jobs on one screen and both groups eventually find faster ways to answer their questions elsewhere.
The missing-decision problem
Now take any tile on your current dashboard and ask:
What would we do differently if this number moved?
That question exposes a surprising amount of clutter.
A KPI should lead somewhere.
If True CAC rises beyond an agreed threshold, someone needs to decide whether acquisition economics still justify the spend. If qualified pipeline falls behind target, someone needs to decide whether the problem calls for more pipeline creation or better conversion.
But if a metric turns red and the response is simply, "Interesting, let's keep watching it," it may be information. It isn't doing the job of an executive KPI.
That's the real dividing line: the dashboard shouldn't show everything you can measure. It should surface the numbers that change what somebody does.
Executive dashboard vs channel dashboard: what actually changes
An executive dashboard and a channel dashboard can use data from the same marketing system.
But they shouldn't be smaller and larger versions of the same screen. They exist to answer different questions.
The executive dashboard answers money questions. Are we acquiring customers profitably? Is there enough qualified pipeline to hit the revenue target? How long will it take to recover acquisition spend? Where should the next increment of budget go?
The channel dashboard answers diagnostic questions. Why is cost per lead rising? Which landing page is leaking conversions? Which campaign is losing efficiency? Which sequence is underperforming?
That difference determines everything else: what gets measured, who reviews it, how often they review it and what happens when a number moves.
| Dimension | Executive dashboard | Channel dashboard |
|---|---|---|
| Who it's for | Founders, executives and growth leadership | Marketers and channel operators |
| The question it answers | Are our marketing economics and qualified pipeline strong enough to support the revenue target? | What is driving performance up or down, and what should we optimise? |
| Typical metric set | True CAC, LTV:CAC with payback period, qualified pipeline created, pipeline coverage, win rate, marketing-sourced and influenced revenue, revenue against target | Cost per lead, CTR, CPC, landing-page conversion, campaign pacing, sequence performance and keyword movement |
| Review cadence | Primarily monthly, with slower-moving ratios reviewed over longer periods | Primarily weekly, with live campaign diagnostics checked more often when needed |
| Who owns the decisions | Founders, executives and growth leadership allocating budget and setting revenue priorities | Channel owners and operators changing targeting, creative, pages, campaigns and sequences |
| Typical failure mode | Too much operational detail obscures the few numbers that should drive business decisions | Too little diagnostic depth leaves operators knowing that performance changed but not why |
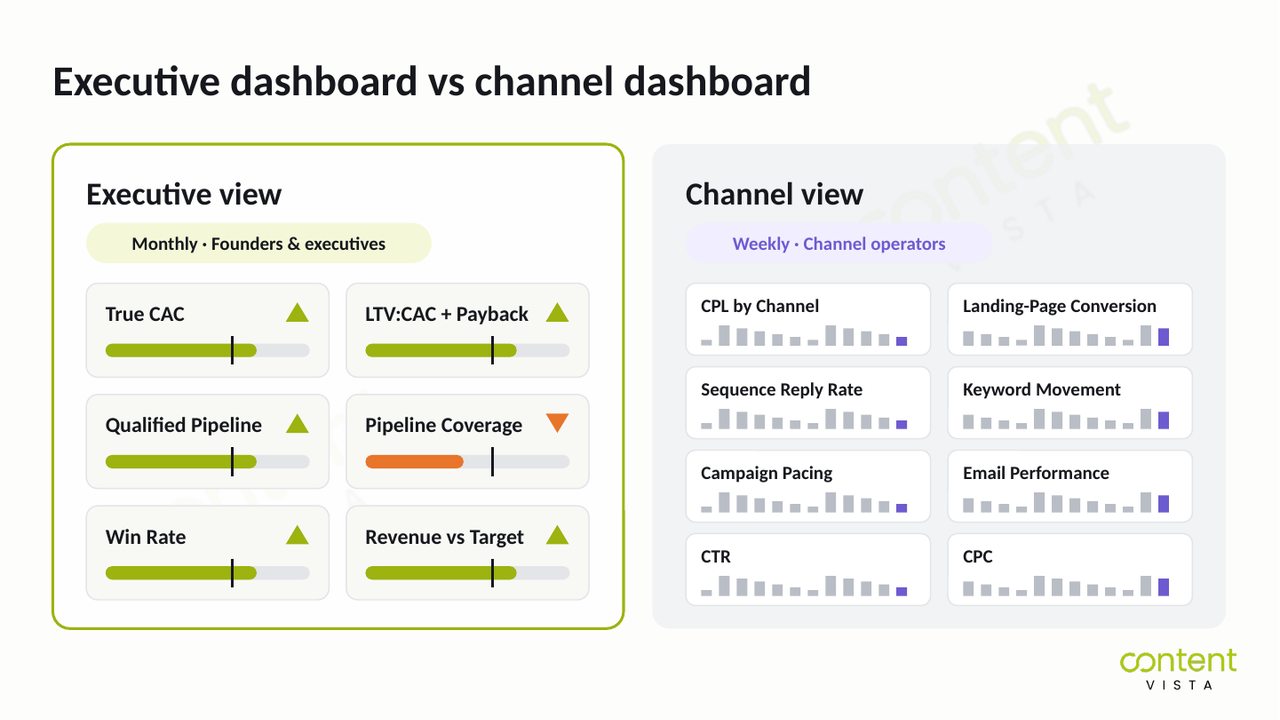
So what happens when you merge these views? Each audience gets more information and less usefulness.
If qualified pipeline falls behind target, the executive dashboard should make that problem obvious. It doesn't need to show every campaign variable that might explain it.
The channel dashboard takes over from there. It gives the operator enough detail to find the cause and act.
In short: one dashboard tells you where the business needs attention. The other helps you work out what to change.
Treating them as separate decision instruments is what makes both more useful.
Which metrics belong on an executive dashboard?
An executive marketing dashboard should contain fewer metrics than most teams expect.
The test isn't whether a number is useful. It's whether that number changes a business decision about acquisition economics, qualified pipeline, conversion, budget or revenue.
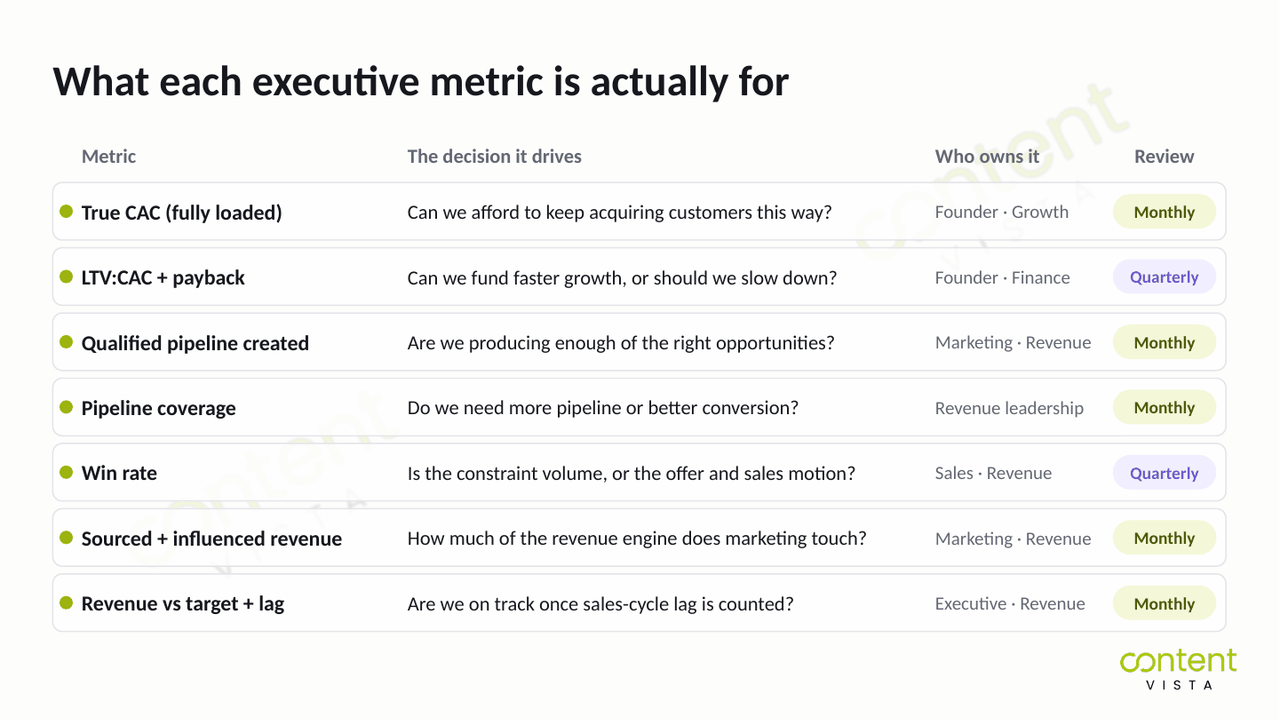
Key metrics for an executive dashboard
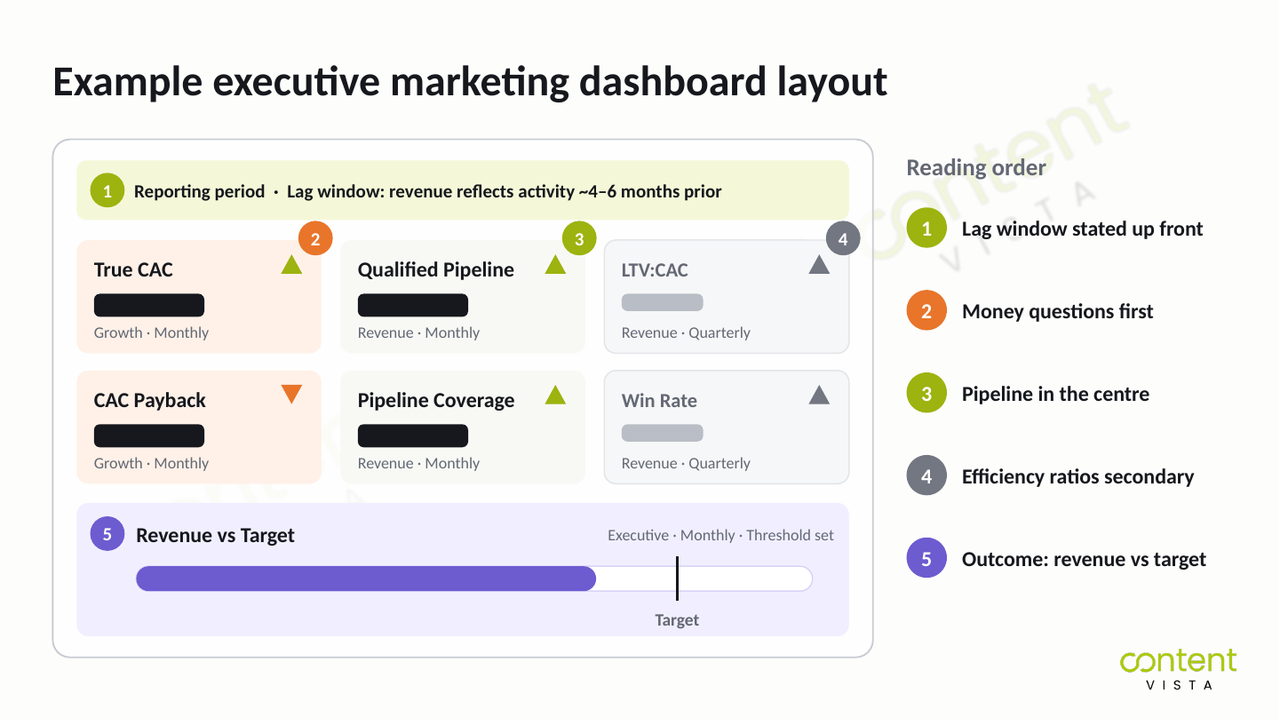
True CAC (fully loaded): Can we afford to keep acquiring customers this way?
LTV:CAC ratio + payback period: Can we fund faster growth, or should we slow down?
Qualified pipeline created: Are we producing enough of the right opportunities?
Pipeline coverage against revenue target: Do we need more pipeline or more conversion?
Win rate: Is the constraint volume or the offer?
Marketing-sourced and marketing-influenced revenue: How much of the revenue engine does marketing touch?
Revenue against target + lag window: Are we on track once sales-cycle lag is accounted for?
True CAC (fully loaded)
True CAC is what it actually costs to acquire a new customer once you include the costs that make acquisition possible: media spend, salaries, tools, agency fees and content costs.
It should be visible as a blended number and, where the data supports it, at channel level.
And cost per lead is not CAC.
The distinction matters because an efficient-looking CPL tells you what it costs to generate a lead. It doesn't tell you what it costs to acquire a customer.
For example, the Confido case study reports 383 leads across three regions at an average CPL of ₹263.
That's one campaign in one region and not a benchmark. It's useful here only because it shows how a CPL figure can exist without telling you the fully-loaded cost of acquiring a customer.
The executive decision is straightforward: can we afford to keep buying customers this way?
Not sure what your fully-loaded CAC actually is? The costs often sit across media, people, tools and external support. Use the True CAC & Marketing ROI Calculator to bring them together and calculate the number behind your dashboard.
LTV:CAC ratio and payback period
LTV:CAC shows the relationship between customer value and acquisition cost.
But at executive level, it should sit beside the CAC payback period.
Payback often makes the decision more tangible, because it turns acquisition efficiency into a cash question: how long does it take to recover what we spent acquiring this customer?
The decision: can we fund faster growth, or does the cash profile mean we need to slow down?
Qualified pipeline created
Lead volume can make marketing look busy without telling leadership whether the funnel is becoming more revenue-positive.
Qualified pipeline created asks a harder question: how much commercially relevant opportunity did marketing help put into the pipeline?
The SalesFed case study reports $400K in qualified pipeline. The important distinction is qualified pipeline: not revenue, and not raw lead volume.
The decision: is the top of the funnel producing enough of the right thing?
Pipeline coverage against the revenue target
Pipeline coverage connects the qualified pipeline currently available with the revenue target it needs to support.
That makes it a forward-looking executive metric.
Instead of waiting for revenue to miss target, leadership can see whether the current pipeline is sufficient, given the business's actual conversion performance.
The decision: do we need more qualified pipeline now, or do we need to convert more of the pipeline we already have?
Win rate
Win rate gives pipeline coverage its context.
A business that converts a larger share of qualified opportunities doesn't need the same coverage as one that converts a smaller share.
That's why win rate belongs beside pipeline created and coverage, rather than appearing as an isolated sales statistic.
The decision: is the constraint insufficient volume, or is the offer and sales motion failing to convert enough qualified opportunities?
Marketing-sourced and marketing-influenced revenue
These should be reported as two separate numbers, not collapsed into one flattering attribution figure.
Marketing-sourced revenue is revenue from opportunities marketing originated. Marketing-influenced revenue (sometimes called pipeline-influenced revenue) captures deals where marketing contributed without necessarily creating the opportunity.
Both should be presented honestly, as estimates, wherever attribution can't establish certainty.
Here's why that honesty matters: B2B purchases are rarely one person's decision.
Forrester's State of Business Buying 2024 research, based on more than 16,000 global business buyers, found that on average 13 people inside the organisation are involved in a buying decision, and most purchases involve two or more departments.
No tracking setup cleanly follows 13 people across months of research.
So a single, precise-looking "attributed revenue" figure is usually claiming more certainty than the data can support.
One practical addition: put a "How did you hear about us?" field on your high-intent forms. Self-reported attribution isn't perfect either, but it captures the podcasts, peer recommendations and private conversations your software never sees.
The decision: how much of the revenue engine does marketing actually touch, and in what capacity?
Revenue against target: with the lag window stated on the dashboard itself
Revenue against target gives executives the outcome they ultimately care about.
But the number becomes misleading when reporting ignores sales-cycle lag.
If today's marketing activity typically creates revenue later, the dashboard needs to state the lag window it's using. Otherwise, it invites a simplistic comparison between this month's marketing activity and this month's closed revenue.
The decision: are we genuinely on track against target once the timing of the revenue-positive funnel is accounted for?
| Metric | The decision it drives | Who owns that decision | How often to review it |
|---|---|---|---|
| True CAC (fully loaded) | Can we afford to keep acquiring customers this way? | Founder / growth leadership | Monthly |
| LTV:CAC ratio + payback period | Can we fund faster growth or should we slow down? | Founder / finance / growth leadership | Quarterly |
| Qualified pipeline created | Are we producing enough of the right opportunities? | Marketing / revenue leadership | Monthly |
| Pipeline coverage against revenue target | Do we need more pipeline or better conversion? | Revenue leadership | Monthly |
| Win rate | Is the constraint volume or the offer and sales motion? | Sales / revenue leadership | Quarterly |
| Marketing-sourced and marketing-influenced revenue | How much of the revenue engine does marketing touch? | Marketing / revenue leadership | Monthly |
| Revenue against target + lag window | Are we genuinely on track once sales-cycle lag is accounted for? | Executive / revenue leadership | Monthly |
The four questions every executive metric has to survive
Choosing executive metrics gets much easier when you stop asking, "Is this useful data?"
Almost every marketing metric is useful somewhere. The better question is whether it deserves space on the executive dashboard.
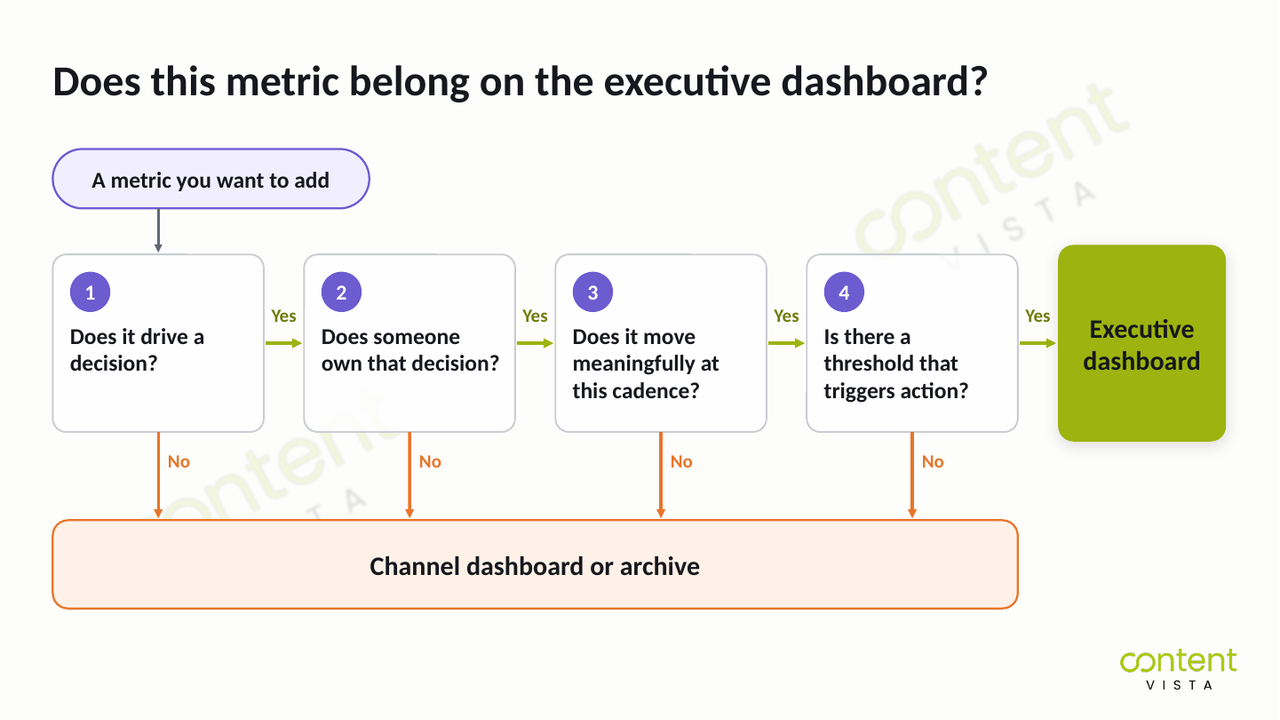
A metric earns that space by surviving four questions.
What questions should you ask before putting a metric on an executive dashboard?
What decision does this number drive?
Be specific about what someone would change if the metric moved. If there's no decision attached, it's information, not an executive KPI.
Who owns that decision?
The person viewing the metric should have the authority to act on it. If the decision belongs to a campaign manager rather than leadership, the metric probably belongs on the channel dashboard.
How often does it genuinely move?
Match the reporting cadence to the speed of the signal. A metric that becomes meaningful quarterly shouldn't manufacture weekly urgency just because the dashboard can refresh every day.
What threshold would make me act?
Decide what meaningful movement looks like before reviewing the number. Without an action threshold, teams can spend whole meetings discussing normal variation without changing anything.
Let's make this practical.
Take social followers. It may be useful for a specific marketing objective. But on many executive dashboards, it fails question one: nobody can name the business decision that should change when the number moves.
Cost per click is different.
It can pass all four questions for a paid-media operator. They can diagnose the movement, own the optimisation decision, review it at the right cadence and act when it crosses an agreed threshold.
But it usually fails question two at executive level, because leadership doesn't own the campaign-level response.
If a metric fails any of these four questions, take it off the executive view. It may still deserve a place on a channel dashboard, or it may simply belong in an archive for occasional analysis.
This test does more work than any generic list of fifteen marketing KPIs, because it decides what matters for your business, your owners and your decisions.
Why your dashboard misleads you if you ignore sales-cycle lag
Here's the problem: a dashboard that compares this month's marketing spend with this month's closed revenue may be comparing two largely unrelated periods.
Say a campaign starts generating qualified opportunities in January, and those opportunities close in June.
January's marketing activity helped produce June's revenue.
Comparing January spend with January closed revenue creates a neat-looking ratio. But it doesn't represent the economics of the same customer cohort.
This is sales-cycle lag in ROI reporting, and the longer your buying cycle, the more damaging the mismatch becomes.
How long is the lag?
There's no single B2B sales cycle that every dashboard can assume.
Optifai's sales-cycle length benchmark, vendor-published data from 939 B2B SaaS companies covering Q2 2025 to Q1 2026, puts the median B2B SaaS sales cycle at around 84 days.
Its segment-level figures also show how dramatically the expected lag changes with deal size.
| Deal size | Typical cycle length |
|---|---|
| SMB (under $15K ACV) | 14–30 days |
| Mid-market ($15K–$50K ACV) | 30–60 days |
| Upper mid-market ($50K–$100K ACV) | 60–90 days |
| Enterprise (above $100K ACV) | 90–180+ days |
| B2B SaaS median (all deals) | Around 84 days |
Ranges reflect the 25th to 75th percentile in Optifai's data.
And buying journeys aren't getting simpler.
In Forrester's 2023 Global B2B Buyers' Journey Survey, based on responses from more than 18,000 global business buyers, nearly 90% said their purchase process had stalled at some point in 2023.
Stalls stretch the gap between the marketing activity that started a deal and the revenue that eventually lands.
So the point isn't to copy one of these ranges into your dashboard. It's to identify your own sales-cycle lag and design reporting around it.
The fix: report cohorts and trailing windows
Instead of forcing spend and revenue from the same calendar month together, track the customers and qualified opportunities generated in a particular acquisition period through the sales cycle.
Then use trailing windows that match your actual cycle.
If your typical journey from acquisition to close takes several months, your executive dashboard should reflect that before declaring marketing efficient or inefficient.
State the assumption on the dashboard itself.
A header such as "Revenue shown reflects marketing activity from approximately 4–6 months prior" gives executives the context they need before interpreting the numbers.
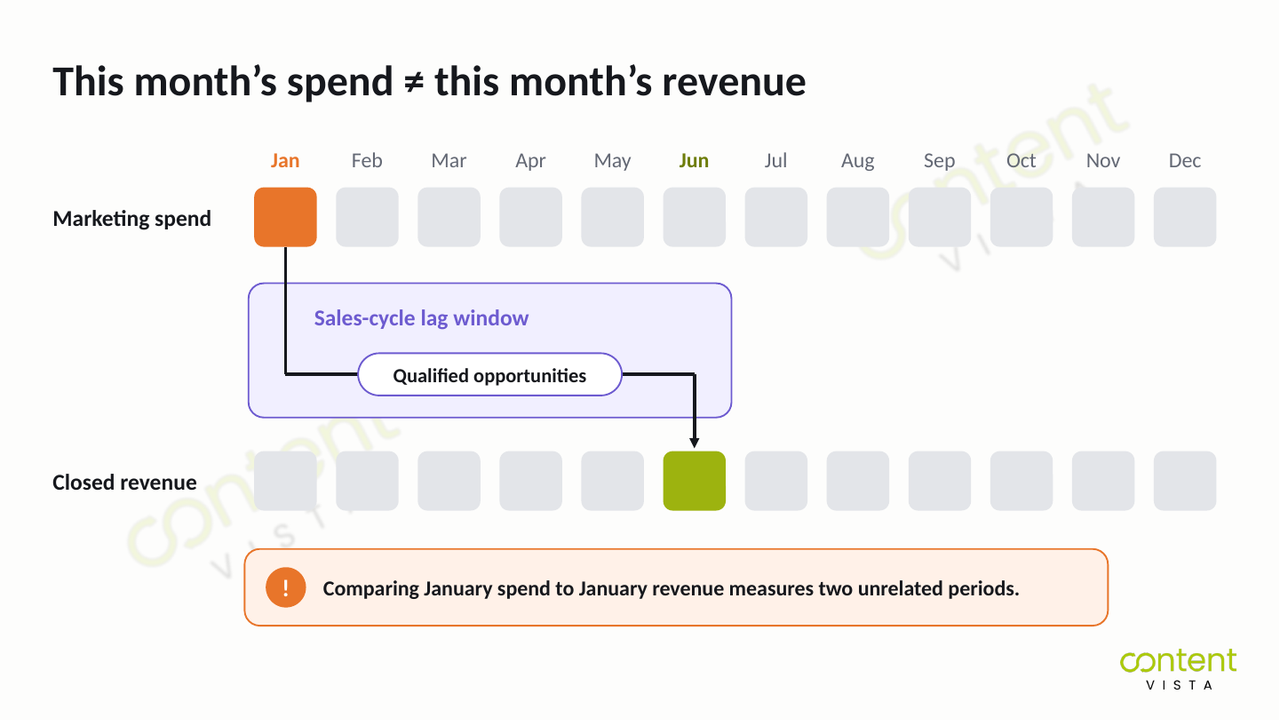
This also explains a common reporting trap.
Month-on-month ROI can create panic in month two, when increased marketing investment hasn't had time to become closed revenue.
The same chart can create complacency in month five, when revenue rises because of pipeline created months earlier, while current pipeline creation is already weakening.
The dashboard isn't necessarily showing incorrect numbers. It's putting correct numbers next to each other in a way that invites the wrong conclusion.
That's why sales-cycle lag isn't a reporting footnote. It's a dashboard-design constraint.
Which benchmarks are real, and which are just repeated?
Marketing dashboards often carry benchmarks that look precise because they've been repeated for years.
The problem is that repetition and evidence aren't the same thing.
We checked the provenance behind several of the most common rules. Some are useful heuristics. Others are conventions with no traceable empirical basis.
The 5:1 marketing ROI rule
You'll frequently see 5:1 described as a "good" marketing ROI.
We went looking for the original research behind that number and couldn't find a traceable primary source. The citation trail keeps leading back to secondary marketing content quoting the same convention.
That doesn't make 5:1 useless. It makes it a widely repeated convention, not a law or research finding.
For an executive dashboard, CAC payback is usually more actionable, because it answers a cash question: how quickly does the business recover the money it took to acquire a customer?
That calculation also depends on knowing what True CAC actually includes.
The 3:1 LTV:CAC ratio
The familiar 3:1 LTV:CAC ratio has a clearer origin.
David Skok, a SaaS founder turned venture capitalist, set it out in SaaS Metrics 2.0, where he describes the best SaaS businesses as having an LTV to CAC ratio above 3.
But it's a heuristic, not research. Skok himself stresses that these are "only guidelines" and that there are situations where breaking them makes sense.
Use 3:1 as orientation, not as a universal pass/fail threshold. And on an executive dashboard, pair LTV:CAC with payback period.
The 3× pipeline coverage rule
This one is even shakier.
Dave Kellogg wrote that he doesn't know the history of the 3× rule and concluded it emerged as a Goldilocks number: 2× seems tight, 4× seems rich, so 3× it is.
He also warns that it becomes self-fulfilling. Once managers insist on 3× coverage, reps produce 3× coverage, whether or not it converts. See Kellogg's analysis of the 3x pipeline coverage prophecy.
There's a more defensible calculation:
Required pipeline coverage = 1 ÷ win rate
At a 33% win rate, you need roughly 3× coverage. At 20%, you need roughly 5×.
Kellogg's own advice goes a step further: derive coverage ratios from your actual historical data, by rep, region or product, rather than adopting any top-down rule.
Your conversion performance should set the number. Not a generic rule.
The 12-month CAC payback bar
A 12-month CAC payback target is best treated as a VC-derived convention, not a survey finding.
It traces back to investor guidelines like Skok's, which treat CAC recovery beyond 12 months as a sign of weak profitability and note that the best SaaS businesses recover CAC in five to seven months.
Real-world data looks quite different.
Aleph and Benchmarkit's 2026 SaaS benchmarks, vendor-published data based on full-year 2025 actuals, put median B2B SaaS CAC payback at 16 months (down from 18 months in 2024). The top quartile sits at six months or less and the bottom quartile at 24 months or more.
So the useful question isn't, "Are we below 12 months?"
It's whether your payback period works for your margins, cash position and growth model.
Win rates and the denominator trap
Win rate looks like the simplest number on the dashboard. It isn't.
RAIN Group's research on average sales win rates, based on 472 sellers and sales executives, reports an average win rate of 47%.
But look at the denominator: RAIN Group defines win rate as the share of opportunities that were proposed or quoted and then won.
That's a perfectly reasonable definition. It's just very different from counting every opportunity that ever entered the pipeline.
Here's how much the definition matters. Imagine a team with 100 opportunities in a quarter. Forty reach proposal stage, and 18 of those close.
Measured against proposals, the win rate is 45%. Measured against every opportunity, it's 18%.
Same team. Same quarter. Same deals.
So comparing your win rate directly with another company's can be badly misleading. It's far more useful as a consistent trend line inside your own funnel, using the same definition over time.
MQL→SQL conversion rates
Vendor-published MQL→SQL benchmarks are all over the place. Depending on who publishes them and how they define an MQL, averages range from the low teens to around 40%.
Treat any of those figures as context, not targets.
MQL definitions vary widely between organisations, so apparently comparable conversion rates may be measuring different things.
The bigger executive problem is definitional.
If marketing and sales don't share a stable definition of "qualified," an impressive MQL headline tells leadership very little about whether the business is creating qualified opportunities.
| The rule | Where it comes from | What it actually is | How to use it |
|---|---|---|---|
| 5:1 marketing ROI | No traceable primary source found | Widely repeated convention | Context only; prioritise fully-loaded CAC and payback for executive decisions |
| 3:1 LTV:CAC | David Skok, SaaS Metrics 2.0 | An investor's guideline, explicitly described by its author as a guideline | Directional reference; pair with CAC payback period |
| 3× pipeline coverage | No empirical origin established; described by Dave Kellogg as a Goldilocks rule of thumb | Rule of thumb that tends to become self-fulfilling | Calculate your own coverage as 1 ÷ win rate, from your own historical data |
| 12-month CAC payback | VC guidelines, including Skok's SaaS Metrics 2.0 | Heuristic, not a survey finding | Judge payback against your economics, cash position and growth model |
| MQL-to-SQL rates | Vendor-published benchmarks | Definition-dependent ranges | Track your own consistently defined funnel rather than treating external ranges as targets |
What belongs on a channel dashboard instead
Removing a metric from the executive dashboard doesn't mean it has no value.
It usually means the metric answers a diagnostic question rather than a business-level decision.
That's the job of the channel dashboard.
The channel view should give the person running marketing enough detail to identify what changed, where it changed and what they can do about it.
Cost per lead by channel helps diagnose acquisition efficiency at the lead level.
If CPL starts rising, the operator can investigate audience saturation, creative fatigue or a shift in campaign performance. It's useful operationally, but remember: cost per lead is not CAC.
Click-through rate and cost per click help diagnose what's happening between an impression and a site visit.
Movement here can point attention towards targeting, creative or ad-message performance before the problem travels further down the funnel.
Landing-page conversion rate tells you what happens after the click.
If traffic stays stable while conversion falls, that can point to a break in message match, page experience or the offer. This is one place to investigate where funnel leakage costs you pipeline.
Email and sequence performance helps diagnose whether outreach is reaching and resonating with the right people.
A falling reply rate, for example, should prompt a look at list quality, messaging or the offer, not an immediate executive-level budget decision.
Keyword and ranking movement helps the search owner see whether visibility is strengthening or weakening for the queries the business targets.
It's diagnostic context, not a substitute for qualified pipeline or revenue.
Campaign pacing against budget answers a more immediate operational question: are campaigns spending to plan, and does the operator need to intervene before the reporting period ends?
These metrics belong primarily to the marketers and channel owners who can change targeting, creative, landing pages, outreach and campaign settings.
They're generally reviewed weekly, with some live campaigns needing daily checks when active intervention is useful.
A functioning lead generation system needs both levels of visibility, without confusing their jobs.
The relationship is simple: the executive dashboard tells you that something needs attention; the channel dashboard helps you find out why.
If True CAC rises, qualified pipeline falls or revenue moves off target, leadership doesn't need 30 extra tiles on the executive screen.
That movement is the signal. The channel dashboard is where the operator follows the signal downstream, diagnoses the cause and decides what to change.
How often should each metric be reviewed?
A dashboard can show you fresh data every few minutes.
That doesn't mean every metric deserves to be reviewed every few minutes.
Here's the thing: reviewing a slow-moving metric on a fast cadence manufactures decisions out of noise.
If your sales cycle is six months, checking pipeline conversion every week doesn't suddenly make it a weekly signal. Much of the movement you see may simply reflect incomplete cohorts and normal variation, not a meaningful change in the underlying system.
The right cadence depends on how quickly the metric genuinely becomes decision-useful, not how often your software refreshes it.
Campaign pacing can need daily attention during an active campaign, because an operator can intervene immediately.
Channel diagnostics such as cost per lead, click-through rate, landing-page conversion and sequence performance usually make more sense weekly, once enough data has built up to diagnose movement.
Executive money metrics such as True CAC, qualified pipeline created, pipeline coverage and revenue against target generally belong in a monthly review.
Ratios that depend on more complete customer or opportunity cycles, including LTV:CAC, CAC payback and win rate, suit a quarterly view.
| Type of metric | Review cadence |
|---|---|
| Live campaign pacing | Daily when active intervention is required |
| Channel diagnostics | Weekly |
| Qualified pipeline created and pipeline coverage | Monthly |
| True CAC and revenue against target | Monthly |
| LTV:CAC and CAC payback | Quarterly |
| Win rate | Quarterly |
There's another discipline that matters just as much as cadence: set the threshold for action before you look at the number.
If True CAC rises, how far must it move before you investigate? If pipeline coverage falls, at what point does the team change its plan?
Decide that in advance.
Otherwise, every dashboard review becomes an exercise in explaining whatever happened most recently.
A small movement gets a story. The story creates a reaction. And the team risks replacing predictable lead generation with constant tactical adjustment.
The goal isn't to review marketing more often. It's to review each signal when it's mature enough to support a decision.
How to build an executive dashboard in six steps
You don't need to start with dashboard software.
Start with the decisions the dashboard needs to support, then work backwards into the data.
That prevents the familiar outcome: a technically impressive screen full of numbers nobody knows how to use.
1. Write down the money questions first
Before opening any tool, write down three to five questions in plain language that leadership needs the dashboard to answer.
For example: Are we acquiring customers profitably? Do we have enough qualified pipeline to hit the revenue target? Are we recovering acquisition spend quickly enough? Where should the next increment of budget go?
If the revenue target itself needs translating into a measurable gap, use the Revenue Milestone Gap Calculator before deciding what the dashboard needs to monitor.
2. Fix the denominator
Now gather the costs required to calculate fully-loaded CAC.
That means more than ad spend. Pull together media spend, salaries, tools, agency fees and content costs associated with acquiring customers.
If those costs sit in different systems or budgets, reconcile them before building the KPI layer.
Otherwise, you can build a beautifully automated dashboard around a CAC number that's missing a substantial part of the acquisition system.
3. Set the lag window
Decide which trailing period of marketing activity should be compared with revenue, based on your actual sales-cycle lag.
Then put that assumption on the dashboard itself.
If revenue generally reflects marketing activity from several months earlier, state that clearly in the header. Don't make executives remember the attribution window every time they read the screen.
4. Choose the metric set
Take every proposed metric through the four questions from earlier:
Does it drive a decision? Who owns that decision? How often does it genuinely move? What threshold triggers action?
If it fails, move it to the channel dashboard or archive it.
Then apply one final constraint: the executive metric set must fit on one screen without scrolling.
The objective isn't maximum visibility. It's maximum decision clarity.
5. Assign an owner and a cadence to each metric
Every KPI needs someone responsible for the decision attached to it.
True CAC might belong to growth leadership. Qualified pipeline and coverage may need shared revenue ownership. Channel-level diagnostics belong with the operators who can actually change campaigns.
Then assign the right cadence: daily or weekly for fast operational signals, monthly for executive money metrics and quarterly for ratios that depend on fuller customer or opportunity cycles.
A metric with no owner is a metric with no decision.
6. Set action thresholds
Finally, decide what happens when each metric moves before it moves.
If True CAC rises beyond an agreed level, what gets investigated? If qualified pipeline drops below what the revenue target requires, does the response focus on pipeline creation or conversion? If win rate deteriorates, who looks at the offer and sales motion?
The threshold doesn't just tell you that something changed. It tells the team when observation becomes action.
What does this take to stand up?
Steps 1, 3, 5 and 6 can usually be worked through in a couple of focused hours, if the right people are in the room.
Step 2 is what tends to take real effort, because acquisition costs often live across media platforms, payroll, software subscriptions and external partner spend.
The dashboard build is rarely the difficult part. Getting the inputs honest is.
And no, you don't need to buy a dashboard tool first.
A spreadsheet is perfectly adequate until the manual cost of assembling it exceeds the value of the decisions it supports. Automation should solve an established reporting problem, not precede one.
When greater integration is justified, marketing automation and CRM systems and broader systems, conversion and growth infrastructure can connect the reporting layer across the tools you already use.
Content Vista designs reporting across whatever you already own.
Common marketing dashboard mistakes (and the fix for each)
A useful dashboard can still mislead you when the definitions, timing or decisions underneath it are wrong.
These are the mistakes worth checking before you add another chart or buy another reporting tool.
Putting cost per lead on the executive dashboard and calling it CAC. Cost per lead tells you what it costs to generate a lead, not to acquire a customer. Fix: calculate True CAC using the fully-loaded acquisition cost, including media spend, salaries, tools, agency fees and content costs.
Reporting this month's spend against this month's revenue. In a business with sales-cycle lag, those numbers may come from different customer cohorts. Fix: use cohorts and trailing windows, then state the lag window directly on the dashboard.
Headlining MQL volume when marketing and sales don't share a definition of "qualified." A rising MQL count means little if the two teams classify quality differently. Fix: agree the qualification criteria first, and prioritise qualified opportunities and qualified pipeline at executive level.
Reporting one "attributed revenue" figure as though it were precise. Marketing can touch a buying journey without being the sole source of the eventual revenue. Fix: report marketing-sourced and marketing-influenced revenue separately, and present attribution honestly as an estimate where certainty isn't possible.
Adding a metric because the tool offers it. Availability is not a reason for executive visibility. Fix: ask what decision the metric drives, who owns that decision, how often it genuinely moves and what threshold triggers action.
Reviewing every metric at the same cadence. Daily refreshes can make slow-moving business metrics look more actionable than they are. Fix: review campaign pacing daily or weekly, channel diagnostics weekly, executive money metrics monthly and full-cycle ratios quarterly.
Building the dashboard before agreeing on the definitions. Automating inconsistent definitions only makes disagreement faster. Fix: define CAC, qualified pipeline, sourced revenue, influenced revenue, win rate and the relevant lag window before building the reporting layer.
Having no thresholds, so every movement becomes a discussion. Without a predefined trigger, teams can build a story around almost any change. Fix: decide in advance what level of movement requires investigation, intervention or a change in budget.
The common thread? A dashboard becomes useful when every number has a stable definition, the right timing and a decision attached to it.
When a dashboard is the wrong fix
A better dashboard can't fix a measurement system that isn't ready to support one.
Before investing more time in reporting, check whether the problem actually sits underneath the dashboard.
The volume problem
If you close four deals a quarter, a monthly conversion-rate trend line can behave more like a random-number generator than a useful management signal.
One extra win or loss can make the percentage look dramatically different, without proving the underlying system improved or deteriorated.
In that situation, adding more charts creates false precision.
Build enough evidence first, use longer reporting windows where it makes sense and resist making decisions from movements your volume can't support.
The definitions problem
If marketing and sales disagree about what counts as a qualified lead, a qualified opportunity or a marketing-sourced deal, a dashboard won't resolve the disagreement.
It will industrialise it.
Before automating the reporting, agree on the definitions, ownership and handoff rules underneath it.
The same applies to marketing attribution. If the organisation hasn't agreed what "sourced" and "influenced" mean, displaying attributed revenue to the decimal point doesn't make the number more precise.
The theatre problem
Some executive dashboards exist because marketing is expected to look accountable.
That produces polished charts, traffic-light indicators and weekly reporting rituals, without answering the only question that matters: what decision changes when this number changes?
If True CAC rises and nobody has agreed what happens next, or pipeline coverage turns red without triggering any action, you haven't built a decision instrument.
You've built decoration.
In that case, fix the decision process before redesigning the dashboard.
What about one unified dashboard?
There's a fair objection to separating executive and channel views: multiple dashboards can fragment definitions until different teams are effectively arguing from different versions of reality.
That concern is valid. But the answer isn't to put every metric onto one screen.
Layering means different views and attached decisions, not separate data pipelines.
The executive and channel views should draw from the same agreed definitions and underlying data. What changes is the level of detail, the owner, the cadence and the decision each view supports.
There's also a legitimate place for real-time consolidated reporting.
During fast-moving operational work, seeing campaign pacing, conversion and other diagnostics together can help operators intervene quickly. The argument against fast-cadence reporting applies to slow-moving executive signals, not to every marketing metric.
Sometimes the dashboard is the problem.
Sometimes it's simply revealing that the connected growth system underneath it isn't mature enough yet.
If the reporting problem is starting to look more like a system problem, use the Marketing Growth Maturity Assessment to identify where the gaps sit before adding another reporting layer.
Frequently asked questions
What are the 5 main KPIs for marketing?
For an executive dashboard, the five most useful KPIs are True CAC, LTV:CAC with payback period, qualified pipeline created, pipeline coverage and revenue against target.
Together, they show acquisition economics, pipeline health and progress towards revenue. An operator's five would be different, because channel metrics diagnose performance rather than drive executive decisions.
What KPIs should my dashboard track?
Track KPIs that survive four questions: What decision does this number drive? Who owns that decision? How often does it genuinely move? What threshold would make you act?
If a metric fails one of those questions, move it to a channel dashboard or archive it, rather than automatically putting it on the executive view.
What should be in a marketing dashboard?
A marketing dashboard should contain the smallest set of metrics its audience needs to make decisions.
Executive dashboards need acquisition economics, qualified pipeline and revenue signals. Channel dashboards need diagnostic metrics such as cost per lead, click-through rate, landing-page conversion, sequence performance and campaign pacing.
What is the difference between a KPI and a metric?
A metric measures something; a KPI measures something important enough to influence a specific decision or objective.
Click-through rate, for example, can be a useful campaign metric without being an executive KPI. The distinction depends on the audience, the owner and the decision attached to the number.
How many metrics should a marketing dashboard have?
There's no universal correct number. An executive dashboard should contain only the metrics that fit on one screen without scrolling and have clear decisions attached.
If adding another metric makes the important signals harder to find, it probably belongs on a separate channel view.
What's the difference between an executive dashboard and a marketing dashboard?
An executive dashboard answers business and money questions: acquisition profitability, payback, qualified pipeline, coverage and revenue performance.
A channel-level marketing dashboard answers diagnostic questions about campaigns, pages and channels. They should share underlying definitions and data, but differ in metrics, owners, cadence and decisions.
How often should you review a marketing dashboard?
Match review cadence to how quickly the metric becomes decision-useful, not how often the software refreshes.
Campaign pacing may need daily or weekly attention, channel diagnostics typically weekly, executive money metrics monthly and full-cycle ratios such as LTV:CAC, CAC payback and win rate quarterly.
What is a good marketing ROI?
There's no traceable primary source establishing the commonly repeated 5:1 marketing ROI ratio as a universal benchmark. Treat it as a convention, not a rule or research finding.
For executive decisions, fully-loaded CAC and CAC payback are often more useful, because they show acquisition economics and cash recovery directly.
Do I need a dashboard tool, or will a spreadsheet do?
A spreadsheet is enough until manually assembling the reporting costs more time and effort than the decisions it supports are worth.
Start by fixing definitions, metrics, ownership, cadence and thresholds. Automate later, once the reporting process is stable enough that automation removes meaningful manual work.
How do you report marketing ROI when the sales cycle is six months?
Don't simply compare this month's marketing spend with this month's closed revenue. Use cohorts and trailing windows that reflect the six-month sales-cycle lag, then state that lag clearly on the dashboard.
The goal is to connect acquisition activity with the revenue period it actually helped produce.
What is pipeline coverage, and is 3x actually the right number?
Pipeline coverage compares qualified pipeline with the revenue target it needs to support. There's no empirical basis for treating 3× as a universal rule.
A more defensible starting point is required coverage = 1 ÷ win rate. A 33% win rate implies roughly 3× coverage; 20% implies roughly 5×.
Fix the denominator first
A useful marketing KPI dashboard isn't the one that shows the most data.
It's the one that gives the right person the right signal, at the right cadence, with a clear decision attached.
But even a perfectly designed dashboard can't compensate for weak inputs.
Your reporting is only as honest as the numbers underneath it. And one of the most important numbers is also one many teams have never fully calculated: True CAC.
If your acquisition cost excludes salaries, tools, agency fees, content costs or the other costs of winning customers, every efficiency ratio built on top of it starts from the wrong denominator.
Fix that number first. Then your dashboard can tell you something worth acting on.
Use the True CAC & Marketing ROI Calculator to bring your acquisition costs together and see the economics underneath your reporting.
If the challenge goes beyond reporting into how the wider growth system is structured, explore marketing strategy and growth consulting.