Quick Summary
- The demand generation funnel metrics that matter are the ones that help you diagnose the engine, not decorate a report.
- Instead of judging performance by MQL volume alone, measure across all four layers of the engine: create, capture, convert and compound.
- The goal is to understand whether your marketing is building future demand, capturing active intent, converting that intent into a qualified pipeline and improving the weakest layer over time.
Demand generation funnel metrics are the numbers used to measure how well your marketing creates demand, captures intent, converts interest into qualified pipeline and improves over time.
The useful metrics are not just activity counts; they show whether your demand engine is creating revenue-relevant movement.
Your dashboard is probably full.
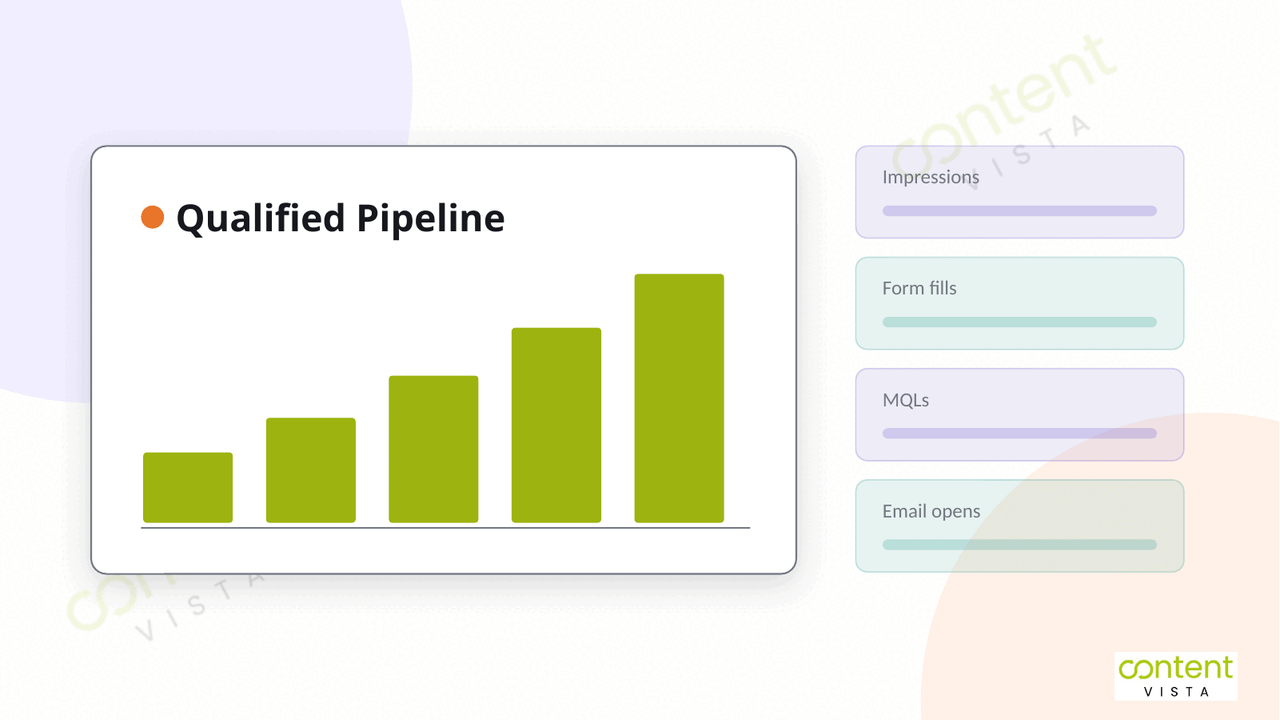
Traffic. Impressions. Form fills. MQLs. Email opens. Webinar registrations. LinkedIn engagement. Campaign reports. Channel reports. Monthly reports.
But here’s the problem: even with all those numbers, many teams still cannot answer the question that matters most:
Is demand generation actually working?
That usually happens because the dashboard is measuring activity, not pipeline. It tells you that marketing is busy. It does not always tell you whether the right people are becoming aware of the brand, showing meaningful intent, entering the funnel, progressing through sales conversations and eventually turning into revenue.
Demand generation funnel metrics should not be treated as one long list of numbers. A better way to measure them is by the stage of the demand engine they belong to.
This is where many teams need to rethink their demand generation strategy. That guide covers how to build the engine itself — the connected system we call the 4C Demand Engine. This page is narrower: it covers how to measure one.
The question is not, “Which metrics should we track?” The better question is, “Which part of the engine are we trying to understand?”
That is the model this article uses:
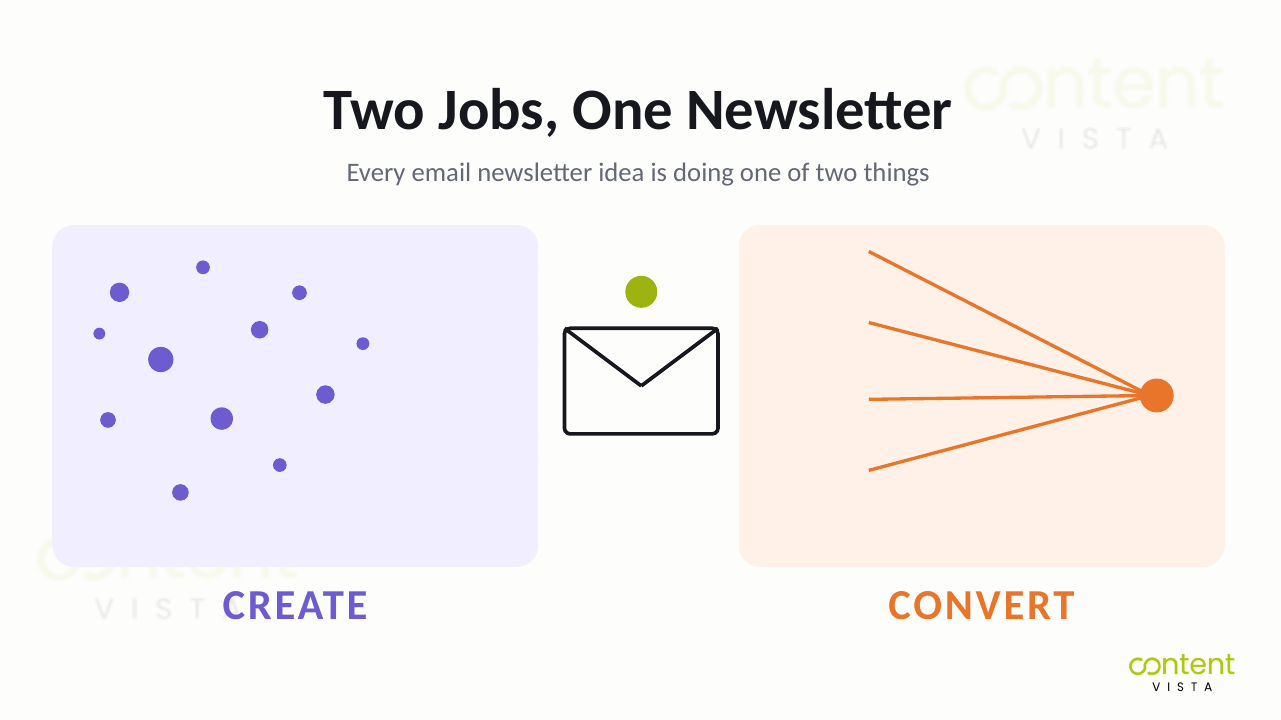
Create: Are we building awareness, trust and future demand?
Capture: Are we turning existing intent into known opportunities?
Convert: Are those opportunities becoming a qualified pipeline?
Compound: Are we improving the system so performance gets stronger over time?
Once you measure demand generation this way, reporting becomes less about proving that campaigns happened and more about deciding what to fix next.
Why Most Demand Gen Dashboards Measure the Wrong Thing
Here’s where most teams go wrong: they treat reporting as proof that demand generation is working.
The dashboard looks healthy because the numbers are moving. Leads are coming in. MQL volume is up. Campaign engagement looks decent. Website sessions are increasing. On paper, marketing seems active.
But activity is not the same as demand. If that distinction still feels blurry, it is worth stepping back to what demand generation actually is before you rebuild the dashboard.
The first problem is that many dashboards celebrate volume metrics that do not reliably predict revenue. Lead counts can rise because the offer is too broad. MQLs can increase because scoring rules are loose. Form fills can look strong while sales still says, “These are not the right people.” When reporting stops at volume, it creates a false sense of progress.
The second problem is bigger: most of the buying journey is invisible.
According to 6sense’s 2024 Buyer Experience Report, B2B buyers are roughly 69% through the purchase process before they engage with sellers and 81% have already chosen a preferred vendor before speaking with sales. The practical consequence is stark.
6sense’s own research into B2B form fill rates found that only 3% to 3.5% of unique website visitors self-identify through on-site forms, leaving roughly 97% of website activity anonymous. That rate held steady across every industry and every region sampled.
So what does that mean?
It means the part of the funnel your dashboard can easily see is only a sliver of the real buying process. You see the form fill, the demo request, the webinar registration, the email click. You do not fully see the months of content consumption, comparison, internal discussion, category education, social proof, referrals and brand familiarity that happened before that moment.
If your dashboard only measures the visible sliver, it is mostly measuring the in-market buyers who are ready to act now. It misses the demand creation work that made those buyers prefer you before they ever converted.
That is why judging demand generation by MQL volume alone is dangerous. It overvalues what is easy to capture and undervalues what actually shapes future pipeline: trust, category relevance, problem awareness, buyer education and repeated exposure before intent becomes visible.
A stronger dashboard does not just ask, “How many leads did we get?”
It asks, “Which part of the demand engine is improving and is that improvement turning into qualified pipeline and revenue?”
A Better Way to Organise Your Demand Generation Metrics
Let’s make this practical.
Instead of asking, “Which demand generation funnel metrics should we track?”, start with a better question:
Which layer of the demand engine are we trying to measure?
That one shift changes the quality of the dashboard. It stops you from mixing awareness metrics, lead metrics, sales metrics and revenue metrics into one confusing report. It also prevents the common mistake of treating MQL volume as proof that demand generation is working.
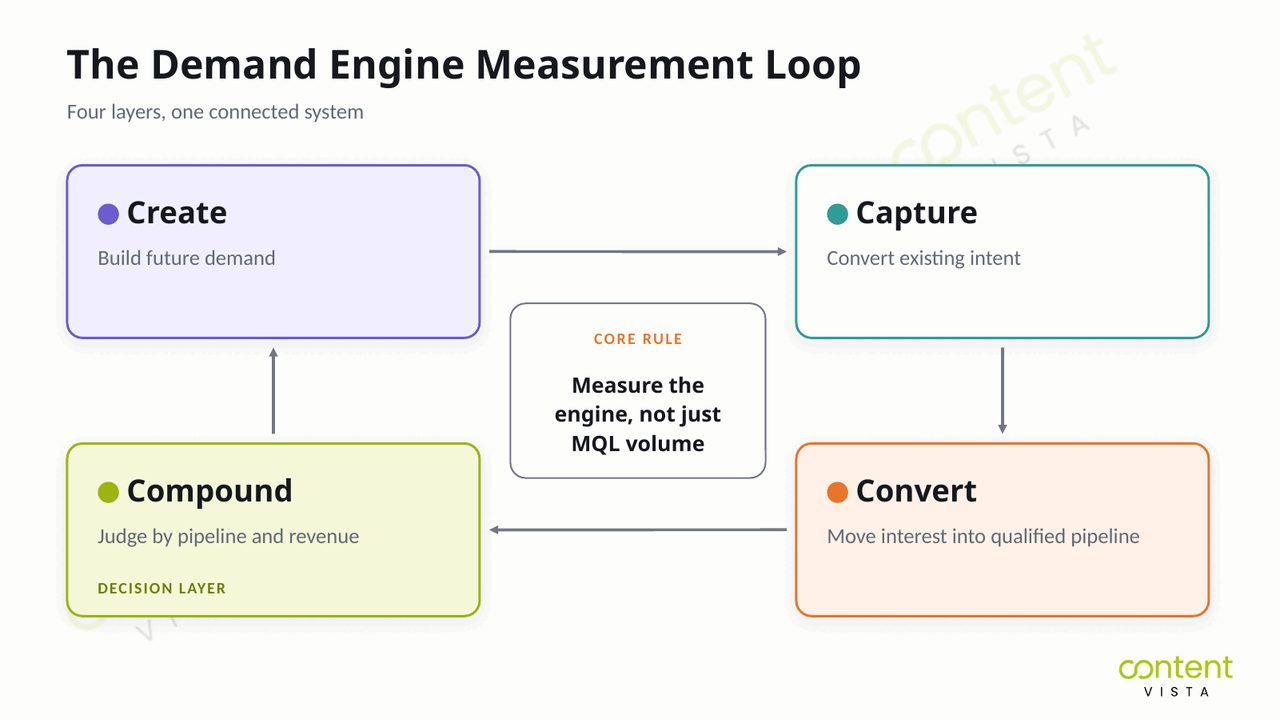
It helps to organise metrics into four layers: create, capture, convert and compound.
Create measures whether you are generating demand among people who may not be ready to buy yet. This is where you look at signals of awareness, trust, content consumption, audience growth, category interest and repeat engagement.
Capture measures whether you are harvesting existing intent. These metrics show whether people who already have a problem are finding you, landing on the right pages, taking action and self-identifying.
Convert measures whether captured interest is becoming a qualified pipeline. This is where form fills and MQLs become less important than qualification quality, meeting progression, sales acceptance, opportunity creation and handoff efficiency.
Compound measures whether the whole system is improving over time. This is the layer where you judge the engine: pipeline contribution, revenue influence, conversion efficiency, CAC movement and whether the weakest layer is getting fixed.
The core rule is simple: you judge the demand engine at the Compound layer, not at the MQL layer.
| Engine Layer | What It Measures | Useful Metrics | What It Helps You Diagnose |
|---|---|---|---|
| Create | Whether future demand is being built among out-of-market buyers | Content engagement, branded search movement, audience growth, repeat visitors, newsletter subscribers, social saves or shares | Whether the market is becoming more aware of your category, problem, point of view and brand |
| Capture | Whether existing intent is turning into known demand | High-intent organic traffic, landing page conversion rate, form fills, demo requests, tool completions, content-assisted conversions | Whether interested buyers can find you, understand the offer and take the next step |
| Convert | Whether captured demand is becoming qualified pipeline | Lead-to-qualified-lead rate, sales accepted leads, meeting booked rate, meeting show rate, opportunity creation rate, nurture progression | Whether lead quality, qualification, follow-up and sales handoff are strong enough |
| Compound | Whether the full demand system is improving over time | Qualified pipeline, pipeline velocity, source-to-revenue visibility, cost per qualified opportunity, CAC trend, revenue contribution | Whether the engine is producing commercially useful outcomes and where reinvestment should go next |
When you view metrics this way, the dashboard becomes a diagnostic tool. It does not just report what happened. It tells you which part of the engine needs attention.
The Metrics That Matter at Each Layer
The cleanest way to measure demand generation is to stop asking, “How many leads did we get?” and start asking, “Where is the engine gaining or losing momentum?”
Each 4C layer needs different metrics because each layer does a different job.
Create-layer metrics
Create-layer metrics measure whether you are building demand before buyers are ready to speak to sales. This layer is harder to attribute directly, so the goal is not to force every activity into a lead-source report. The goal is to watch whether awareness, trust, recall and category relevance are increasing.
Useful Create metrics include reach, share of voice, branded search volume, direct traffic trends, anonymous website traffic patterns, repeat visitors, content engagement, newsletter growth, social saves and self-reported “how did you hear about us?” responses. Most of these are produced by a content-led demand engine rather than by campaigns.
You measure brand here because demand creation usually happens before conversion. This connects to the 95-5 rule, which we’ll cover later: a large part of your market is not ready to buy today, but they may be forming preferences long before they enter the funnel. If you only measure leads at this layer, you will undervalue the work that creates the future pipeline.
Capture-layer metrics
Capture-layer metrics measure whether in-market demand is becoming visible. This is where buyers who already have intent find your website, visit high-intent pages, complete forms, book calls, use tools or raise their hand in some measurable way.
Useful Capture metrics include high-intent page traffic, demo or enquiry requests, form conversion rate, tool completions, MQL-to-SQL rate, source quality and speed-to-lead. A high volume of form fills means very little if those contacts do not match your ideal buyer profile or do not progress into qualified opportunities.
This is also where pipeline leakage often starts. If traffic is strong but enquiry requests are weak, the offer may be unclear. If form fills are strong but MQL-to-SQL rate is weak, the campaign may be attracting the wrong audience. If sales response is slow, intent may cool before the buyer gets a useful next step.
Want to understand whether your current lead volume is enough to support your growth targets? Use the Lead Generation Capacity Calculator to estimate the gap between the leads you are generating and the qualified opportunities you actually need.
Convert-layer metrics
Convert-layer metrics measure whether captured demand becomes a qualified pipeline. This is where marketing and sales alignment becomes visible.
Useful Convert metrics include SQL-to-opportunity rate, sales accepted leads, meeting booked rate, meeting show rate, win rate on marketing-sourced deals, days-in-stage, pipeline velocity and lead response time.
The key question here is: are the right people moving forward? If MQL volume is high but SQL-to-opportunity rate is low, the problem is not “more demand.” It may be weak qualification, poor targeting, a mismatch between content promise and sales reality or a handoff problem.
If opportunities are created but remain stuck for too long, look at days-in-stage and deal progression. The issue may be confidence, urgency, internal buying complexity or missing enablement.
Compound-layer metrics
Compound-layer metrics are where you judge the engine. Not at lead volume. Not at traffic. Not even at MQLs.
This layer measures whether demand generation is producing qualified pipeline and revenue in a way the business can reinvest in. Useful metrics include marketing-sourced pipeline, marketing-influenced pipeline, marketing-sourced revenue, marketing-influenced revenue, average deal size, cost per qualified opportunity, True CAC, CAC payback period, LTV:CAC, pipeline velocity and source-to-revenue visibility.
Cost per qualified opportunity is not the same as cost per lead. It tells you how much it costs to create a commercially useful opportunity, not just a contact in the database. True CAC is also different from cost per lead. True CAC should be fully loaded, including the real cost of acquiring customers across spend, tools, team, execution and supporting resources.
| Metric | Plain-English Meaning | What It Tells You |
|---|---|---|
| Qualified opportunity | A sales opportunity that fits the target buyer profile and has enough intent, need and potential value to justify active pipeline attention | Whether marketing is creating commercially useful demand, not just names in the CRM |
| Qualified pipeline | The total value of qualified opportunities created or influenced by marketing | Whether demand generation is contributing to future revenue |
| Cost per qualified opportunity | The cost required to create one qualified opportunity | Whether your demand capture and conversion efforts are efficient enough to scale |
| True CAC | The fully-loaded cost of acquiring a customer, including spend, tools, team, execution and related acquisition costs | Whether growth is commercially sustainable, not just whether campaigns are producing cheap leads |
| CAC payback period | The time it takes to recover acquisition cost from customer revenue | Whether the business can afford to keep reinvesting in the current growth engine |
| LTV:CAC | The relationship between customer lifetime value and the cost of acquiring that customer | Whether acquired customers are valuable enough to justify the acquisition model |
| Pipeline leakage | The points where demand loses momentum between awareness, capture, qualification, opportunity creation and revenue | Which layer of the engine needs to be fixed before adding more spend |
The Compound layer gives the clearest answer to whether demand generation is working. If qualified pipeline and revenue are improving, the engine is doing its job. If they are not, the dashboard should help you find the weakest layer before you invest more into the wrong part of the system.
Demand Generation Benchmarks: What "Good" Actually Looks Like
Benchmarks are useful only when they are treated as context, not targets. A “good” number depends on your category, sales motion, deal size, qualification rules, channel mix and how strictly your team defines each stage.
Start with MQL-to-SQL. First Page Sage’s MQL-to-SQL benchmark report, built on client data gathered between 2019 and 2025, puts the cross-industry average at around 13%, with a range running from roughly 10% in sectors like legal services and real estate up to around 26% in business insurance and HVAC.
Here’s the important caveat: that 13% is a cross-industry blend, not a number any single company should hold itself to. Some 2026 SaaS commentary places typical B2B SaaS ranges higher, often around 18–22%. And the same research firm’s channel-level data puts MQL-to-SQL anywhere between 26% and 51% depending on where the lead came from.
So what does that mean? It means two accurate reports can be thirty points apart and neither is lying. They are measuring different things, because MQL definitions vary enormously from company to company. A team that stamps “MQL” on every ebook download will look broken at 8%. A team that requires a pricing-page visit plus a fit score will look brilliant at 35%. Same funnel quality, different denominator.
That variation is exactly why a dashboard can show “MQL growth” while qualified pipeline stays flat.
| Funnel Stage | SEO | PPC | Webinar | ||
|---|---|---|---|---|---|
| Visitor to lead | 2.1% | 0.7% | 2.2% | 1.3% | 0.9% |
| Lead to MQL | 41% | 36% | 38% | 43% | 44% |
| MQL to SQL | 51% | 26% | 30% | 46% | 39% |
| SQL to opportunity | 49% | 38% | 41% | 48% | 42% |
| Opportunity to close | 36% | 35% | 39% | 32% | 40% |
Source: First Page Sage’s B2B SaaS funnel conversion benchmarks (June 2025), drawn from 50+ B2B SaaS clients. These are B2B SaaS benchmarks, not universal demand generation benchmarks. Use them to spot where your funnel is unusually weak, not to copy another company’s model.
Look down the MQL-to-SQL row and the real lesson jumps out: SEO converts at 51% while paid search sits at 26%. A blended MQL-to-SQL number can look perfectly healthy while one channel quietly drags the whole funnel down. Segment before you diagnose.
CAC payback is another benchmark worth watching at the Compound layer. Benchmarkit’s 2025 SaaS Performance Metrics Report places the median CAC payback period at around 18 months for SaaS companies in 2024, up from roughly 14 months the year before. The same report found the cost of acquiring new customers moving the wrong way: a median of $2.00 of sales and marketing spend for every $1.00 of new customer ARR, up 14% in a single year.
David Skok’s commonly cited rule of thumb is that under 12 months is ideal, but that should be treated as a heuristic, not research.
Benchmarkit’s own commentary makes one point worth carrying into your reporting: CAC payback correlates more strongly with average contract value than with almost anything else. Bigger deals take longer and cost more to win — and that is not automatically a problem, because an enterprise solution that takes more time and resources to close may be more profitable over its life.
Here’s where most teams go wrong: they benchmark CAC payback against a single industry number instead of against companies with a similar contract value. Compare like with like, or the number will tell you nothing useful.
One more thing worth fixing before you report it. Benchmarkit calculates CAC payback on a gross-margin-adjusted basis:
CAC payback = Sales and marketing expenses ÷ (ARR from new customers × gross subscription margin) × 12
If you are dividing by revenue rather than gross profit, your payback period is flattering you.
| Metric | Benchmark | What It Tells You |
|---|---|---|
| Median CAC payback period | 18 months | Up from around 14 months the previous year: acquisition is getting slower to pay for itself |
| Common “good” threshold | Around 12 months | A rule of thumb, not a benchmark. Judge it against your contract value, not the industry |
| Median new customer CAC ratio | $2.00 | Sales and marketing spend required to acquire $1.00 of new customer ARR, up 14% in a year |
| Bottom quartile new customer CAC ratio | $2.82 | The weakest quarter of companies spend almost $3 to buy $1 of new ARR |
Source: Benchmarkit 2025 SaaS Performance Metrics Report, based on 2024 data from B2B SaaS companies. These are SaaS benchmarks; if you sell services or run a longer, higher-touch motion, use them for direction, not as a target.
Finally, use pipeline coverage carefully. The common “3x pipeline coverage” rule is not a law; it is a thinking tool. The cleaner formula is roughly:
Required pipeline coverage = 1 ÷ win rate
So if your win rate is 33%, 3x coverage makes sense. If your win rate is 20%, you may need closer to 5x. If your win rate is 50%, 2x may be enough.
That is the point of benchmarks: not to make your dashboard look normal, but to help you identify pipeline leakage, weak conversion points and whether the demand engine is producing qualified opportunities efficiently enough to scale.
Why MQL Volume Is a Vanity Metric
Here’s where most teams go wrong: they optimise for the number that is easiest to grow, easiest to report and easiest to defend in a meeting.
MQL volume.
It feels productive because it moves quickly. You can launch a campaign, push a lead magnet, run a webinar, increase form fills, loosen scoring rules and suddenly the dashboard looks healthier. More MQLs. More “marketing contribution.” More activity to show.
But MQL volume does not automatically mean more revenue.
The drop-off after the MQL stage is exactly why this metric becomes dangerous when used as the headline number. As covered in the benchmark section, First Page Sage’s cross-industry data puts MQL-to-SQL conversion at around 13%, and even the strongest channel in its B2B SaaS dataset only reaches 51%. Whichever end of that range you sit at, the message is the same: a large share of MQLs never become qualified pipeline.
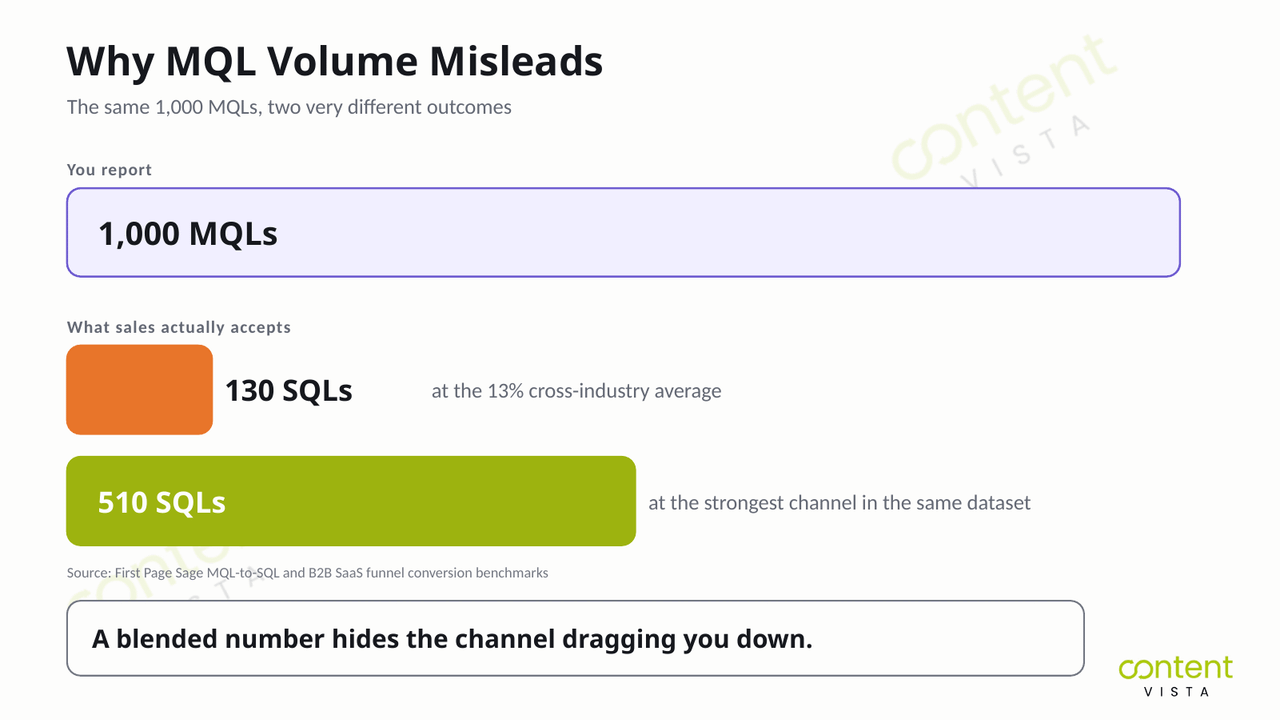
So when a team says, “We generated 1,000 MQLs,” the better question is:
How many became qualified opportunities?
Because a bigger top of the funnel only helps if the lower layers can hold. If targeting is weak, the team creates more bad-fit leads. If the offer attracts the wrong audience, sales wastes more time. If qualification is loose, the pipeline gets inflated. If follow-up is slow, real intent cools. That is not growth. That is pipeline leakage at a larger scale.
MQLs are not useless. They can be a helpful Capture-layer signal. But they should not be treated as the final proof that demand generation is working.
The healthier unit of measurement is the qualified pipeline: opportunities that match the business’s target buyer, show meaningful intent and have enough commercial value to justify sales attention.
| If You Measure This | You May Optimise For | What to Measure Instead | Why It Matters |
|---|---|---|---|
| MQL volume | More contacts, broader offers, looser scoring | Qualified opportunities | Shows whether demand is becoming commercially useful pipeline |
| Cost per lead | Cheap acquisition, low-friction forms, low-fit audiences | Cost per qualified opportunity | Shows what it costs to create an opportunity sales can actually work |
| Campaign engagement | Clicks, opens, attendance, and surface-level activity | Marketing-influenced pipeline | Shows whether marketing touchpoints are helping real opportunities progress |
| Lead source volume | Channels that create the most names in the CRM | Marketing-sourced revenue | Shows which channels create customers, not just leads |
| CPL efficiency | Lower acquisition cost at any quality level | True CAC | Shows the fully-loaded cost of acquiring customers, not just generating leads |
| Top-of-funnel growth | More traffic, more forms, more database growth | Win rate and pipeline velocity | Shows whether demand is turning into revenue at a healthy pace |
The point is not to delete MQLs from the dashboard. The point is to demote them.
Use MQLs to understand one part of the Capture layer. Judge the demand engine by what happens later: qualified opportunities, marketing-sourced revenue, marketing-influenced pipeline, win rate, cost per qualified opportunity and True CAC.
That is the difference between a dashboard that reports activity and a dashboard that tells you whether the growth system is actually working.
How to Measure Demand Creation When You Can't See It
And here’s the part nobody tells you: the most important demand creation work often happens before your dashboard can see the buyer.
That is why Create-layer measurement is uncomfortable. You are trying to measure future demand among out-of-market buyers, not just active intent from people ready to fill out a form today.
Professor John Dawes of the Ehrenberg-Bass Institute, in a paper written for the LinkedIn B2B Institute in 2021, explains the 95-5 rule: at any one time, roughly 5% of buyers are in-market and about 95% are out-of-market. His own illustration is simple — if companies change their bank or law firm roughly every five years, only about 20% are in the market in a given year, and something like 5% in a given quarter.
Dawes is explicit that this is a heuristic rather than a law. In his original write-up of the 95-5 rule, he notes the 95% figure is not meant to be precise, and that you can calculate your own split from your category’s average interpurchase time. The rule sits within the LinkedIn B2B Institute’s wider “How B2B Brands Grow” research with the Ehrenberg-Bass Institute.
The direction is what matters. Most potential buyers are not ready to buy right now.
That means lead metrics mostly measure the visible 5%. They tell you who raised their hand after becoming active. They do not tell you how many out-of-market buyers are starting to understand the problem, remember your brand, trust your point of view or prefer you before they ever enter a buying process.
So demand creation needs different signals.
You measure it through brand and mental availability indicators: reach among the right audience, share of voice, branded search growth, direct traffic trends, repeat anonymous visits, content consumption patterns, social saves, newsletter growth and the quality of conversations happening around your category.
None of these are perfect. But they are useful because they help answer a better question:
Are we becoming easier to remember when the buyer finally enters the market?
Self-reported attribution should be one of the primary instruments here, not a footnote. Ask buyers, leads, demo requesters and high-intent form submitters: “How did you hear about us?” or “What made you reach out today?”
This matters because last-touch attribution systematically under-credits demand creation. A buyer may first hear about you through a podcast, founder post, webinar clip, peer recommendation, comparison article, or LinkedIn discussion — but your CRM may credit the final Google search or direct visit.
Chris Walker and Refine Labs have strongly popularised this framing; they are commercially interested sources, but the core point is well-corroborated by how modern buying journeys actually behave: the visible conversion is rarely the whole story.
You also need to separate pipeline-sourced from pipeline-influenced revenue.
Pipeline-sourced means marketing originated the first measurable touch that led to the opportunity.
Pipeline-influenced means marketing touched the deal somewhere in the buying cycle, even if it did not originate the first touch.
Pipeline-influenced revenue usually runs higher than pipeline-sourced revenue, which makes it useful but also easy to game. If every email open, retargeting view, or casual page visit counts as “influence,” the number becomes inflated.
A stronger approach is to pair pipeline-influenced revenue with self-reported attribution. If the CRM says marketing influenced the deal and the buyer says your content, founder visibility, newsletter, webinar or market point of view helped shape their decision, you get a more honest picture of demand creation.
Demand creation is not invisible because it is unimportant. It is invisible because most dashboards are built to measure capture, not memory, trust, preference and future intent.
The goal is not to force Create-layer activity into fake precision. The goal is to build a measurement system that respects the difference between demand creation and demand capture — because the two are measured in completely different currencies. The same logic applies to nurturing demand over time, where the payoff shows up months after the activity does.
The Four Demand Gaps: What a Bad Number Is Telling You
A red number on your dashboard is not automatically useful.
Low branded search. Weak form conversion. Poor MQL-to-SQL movement. Slow lead response. Stalled opportunities. Each one tells you something is wrong, but not always what to fix.
So what does that mean for you?
The job of measurement is not just to report underperformance. It is to diagnose the gap. Four demand gaps do most of the diagnostic work here: each one translates a bad number into a specific part of the engine that needs attention.
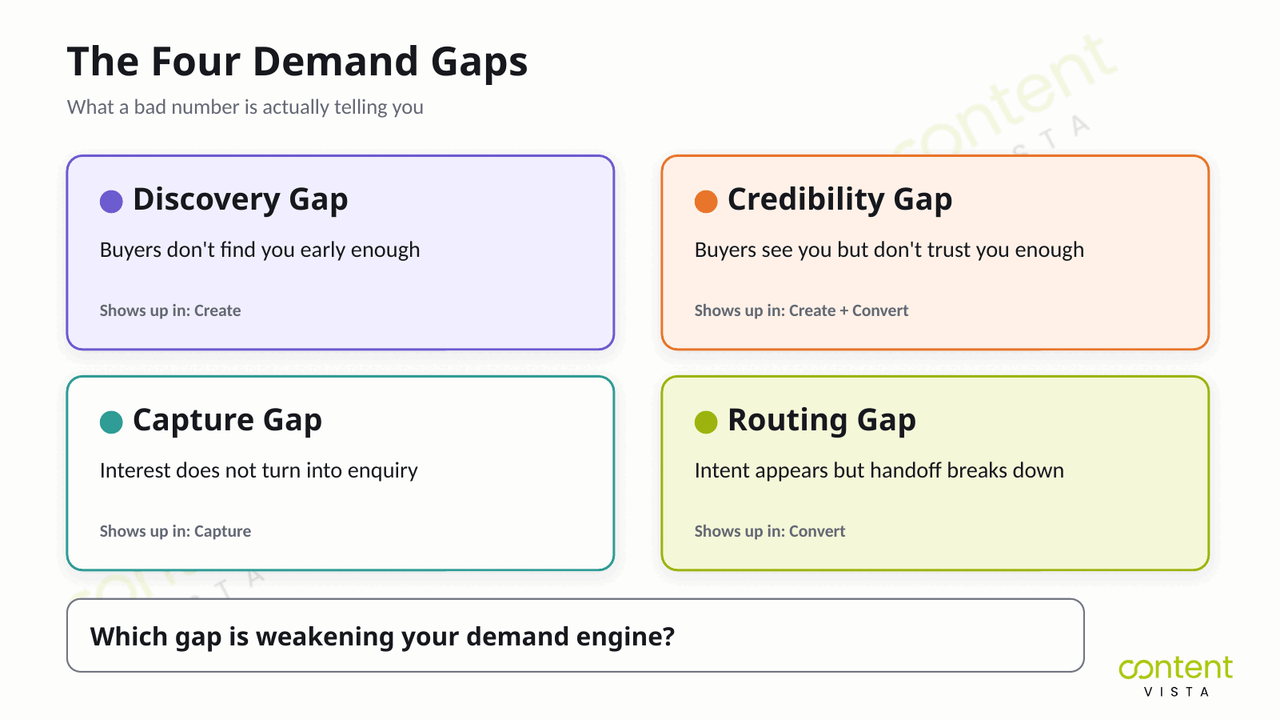
| Demand Gap | Where It Shows Up | What the Bad Number Means | What to Fix First |
|---|---|---|---|
| Discovery gap | Create layer | Buyers are not finding you early enough. Branded search, reach, direct traffic, repeat visits, and category visibility are flat. | Improve demand creation: sharper point of view, better content distribution, stronger founder or brand visibility and more consistent category education. |
| Credibility gap | Create + Convert layers | Buyers see you, but do not trust your perspective enough to shortlist you. This matters because 6sense’s 2024 buyer research found that 81% of buyers already have a preferred vendor at first contact. | Strengthen proof, case studies, comparison content, expert commentary, objections handling and messaging that explains why your approach is different. |
| Capture gap | Capture layer | Demand exists, but the path from interest to enquiry is broken. Form conversion drops, high-intent pages underperform or MQL-to-SQL movement is weak. | Fix landing pages, offers, forms, qualification logic, high-intent content paths and enquiry journeys. |
| Routing gap | Convert layer | Intent appears, but the handoff breaks down. Lead response is slow, CRM stages are messy, ownership is unclear or deals stall in-stage. | Improve speed-to-lead, sales handoff rules, CRM routing, follow-up sequences, qualification criteria and stage progression. |
The discovery gap is the earliest warning sign. If the right buyers are not encountering your brand before they are ready to buy, your Capture metrics may look quiet even when the market opportunity is real.
The credibility gap is more subtle. People may read, watch, visit or engage — but still choose someone else. This is where generic content, weak positioning and missing proof damage pipeline before the enquiry ever happens.
The capture gap shows up when interest is present but the conversion path is weak. The buyer reaches your ecosystem, but the offer, page, form, tool or message does not move them forward.
The routing gap happens after intent becomes visible. The buyer raises their hand, but the system slows them down. The CRM misroutes them. Sales responds late. Follow-up is generic. The opportunity loses momentum.
Not sure which demand gap is holding back your growth system? Take the Marketing Growth Maturity Assessment to identify whether your engine is weakest at create, capture, convert or compound — and what to fix next.
Putting It Together: Metrics as Part of a Connected System
By this point, the problem should be clear: your demand generation metrics did not feel broken because you picked the wrong KPIs.
They felt broken because the system underneath them was not connected.
That is the real issue. It is a system problem, not a tactics problem.
If demand generation services are creating awareness but the website is not built to capture intent, the dashboard will under-report demand. If SEO built to capture buyer intent is bringing in high-intent traffic but the landing pages do not move buyers forward, pipeline leakage will show up as weak form conversion.
If your conversion-led systems are unclear, buyers may engage but never become qualified opportunities. If the CRM and routing layer is disconnected, sales handoff breaks down and demand gets lost after it becomes visible.
This is why the four layers matter. Create, capture, convert and compound are not separate reporting categories. They are connected layers of one growth system.
You can see this in the case evidence too.
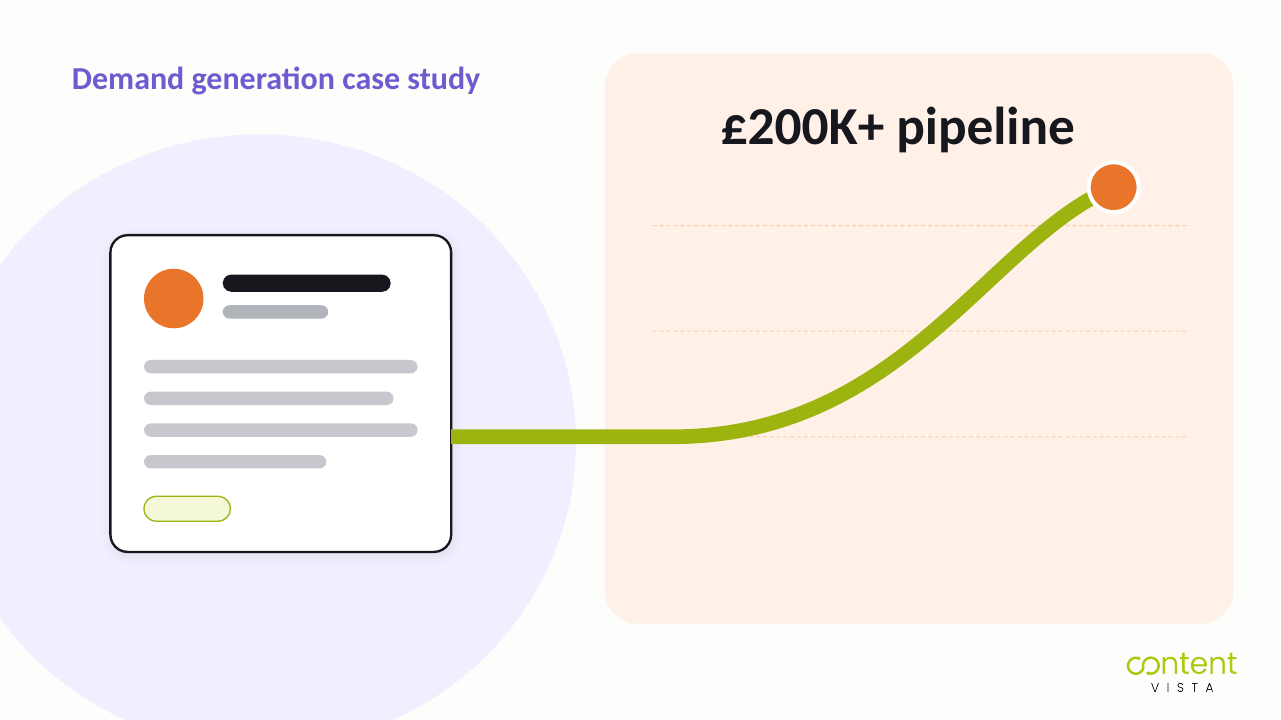
Akshar Business Consulting is a good example of Create-layer compounding. A content-led inbound system built £200K+ in pipeline and 4,000+ subscribers. If you only watched short-term lead volume, you could easily miss the value of the audience, trust and authority being built before revenue showed up.
Personam shows a similar point from a founder authority angle. A 41.8% newsletter open rate and cybersecurity-focused thought leadership are not “just engagement.” They are demand creation signals: the market is paying attention before every reader is ready to become a lead.
Then there are Compound-layer outcomes. SalesFed generated a $400K pipeline. Confido generated 383 leads. Those numbers matter because they sit closer to business impact. But they only become useful when you understand which layers created them, captured them, converted them and helped them compound.
A strong demand generation dashboard does not just report performance. It shows how Create, Capture, Convert and Compound work together and where the system needs to be strengthened next.
That is the outcome to aim for: not a dashboard full of disconnected numbers and not a campaign plan that resets every quarter.
When the engine is connected, content builds memory. Search captures intent. Conversion paths turn interest into a qualified pipeline. CRM and automation protect the handoff. Measurement shows what to fix next.
That is when pipeline and revenue start compounding instead of starting from zero again every quarter.
Frequently Asked Questions
What are demand generation funnel metrics?
Demand generation funnel metrics measure how well your marketing creates demand, captures intent, converts interest into qualified pipeline and compounds into revenue. The useful metrics are not just lead counts. They show whether the demand engine is improving across all four layers: create, capture, convert and compound.
What’s the difference between demand generation metrics and lead generation metrics?
Demand generation metrics measure the full motion: awareness, trust, intent, pipeline, revenue and compounding growth. Lead generation metrics measure a narrower motion: how many people became identifiable leads. They are connected, but not the same. Lead generation is mostly Capture; demand generation includes Create and Compound too.
What is a good MQL-to-SQL conversion rate?
A good MQL-to-SQL conversion rate depends heavily on industry, channel, offer and how your company defines an MQL. As a broad reference, First Page Sage puts the cross-industry average at around 13%, while B2B SaaS ranges often run higher and vary by channel from roughly 26% to 51%. Treat benchmarks as diagnostics, not laws.
Is MQL volume a vanity metric?
MQL volume becomes a vanity metric when it is treated as proof of revenue impact. MQLs can help measure Capture-layer activity, but they do not prove pipeline quality. What matters more is whether MQLs become qualified opportunities, marketing-sourced pipeline, marketing-influenced revenue and customers.
What’s the difference between pipeline-sourced and pipeline-influenced revenue?
Pipeline-sourced revenue means marketing originated the first measurable touch that led to the opportunity. Pipeline-influenced revenue means marketing touched the deal somewhere during the buying journey. Influenced revenue is useful, but it can be inflated, so pair it with self-reported attribution and sales context.
What is a good pipeline coverage ratio?
A common pipeline coverage rule of thumb is 3x, but it is only a heuristic. A cleaner way to think about it is: required pipeline coverage is roughly 1 divided by your win rate. If your win rate is lower, you need more pipeline coverage to hit the same revenue target.
What is a good CAC payback period?
A good CAC payback period depends on deal size, margin, retention and sales motion. Benchmarkit puts the SaaS median at around 18 months, while under 12 months is often treated as an ideal rule of thumb. Use it to judge reinvestment capacity, not campaign performance alone.
How do you measure demand generation when most of the journey is anonymous?
Measure anonymous demand generation through brand and intent signals: branded search, direct traffic, repeat visits, share of voice, content engagement, self-reported attribution and pipeline-influenced revenue. These signals are imperfect, but they help reveal demand creation that last-touch attribution usually misses.
What is the 95-5 rule?
The 95-5 rule, set out by Professor John Dawes of the Ehrenberg-Bass Institute for the LinkedIn B2B Institute, says that at any given time only a small share of buyers are in-market while most are out-of-market. The exact split is illustrative, not universal. The implication is important: lead metrics mostly measure active buyers, while demand creation must build memory before buyers are ready.
How does sales-cycle length affect demand gen attribution?
Longer sales cycles make attribution harder because buyers interact with more content, people, channels and internal stakeholders before converting. The first touch, last touch and form fill rarely tell the full story. For longer cycles, combine CRM data, self-reported attribution, pipeline influence and sales feedback.